The last time I took a formal statistics course was when I was an undergrad at Lewis & Clark. I think I got a C. This was a few years before I got serious about math and doing well in school. Needless to say, I wanted this time around to be different.
Instructor
The course was taught by a graduate student named Kit Clement. He started off class by sharing that he competed in Rubik’s cube solving events. Rather than bragging about it, though, he just wanted to address it quickly and move on so that it didn’t derail a lecture halfway through the term. In case you’re wondering, his 3x3x3 record is 9.43 seconds.
Kit was energetic and engaging. He struck a good balance between cultivating a laid-back class atmosphere (he joked a lot and told stories from time to time) but he also stuck to the material and didn’t appear to get off-track. He also let us take a ten minute break in the middle of every class.
Subject Matter
The course covered three overlapping topics: probability, statistics, and R, a programming language with a focus on statistics.
Probability
We focused on sample spaces, combinatorics, some set theory, and conditional probability. My main takeaway from these sections was how counterintuitive probability often is. A perfect example (which we didn’t actually cover in class) is the Monty Hall problem.
Statistics
Statistics made up the bulk of the course. We covered random variables and probability distributions, joint probability distributions, confidence intervals, the central limit theorem, estimation, and linear regression.
Of all of these topics, I found the central limit theorem to be the most interesting. It states (in a very small nutshell) that when you take the means of a bunch of different samples, the distribution of those means will approximate the normal distribution, even if what you were sampling to begin with didn’t actually follow a normal distribution. Here’s a Khan Academy video on the subject.
The most valuable topic, in my opinion, was probability distributions. If one of the chief aims of statistics is to make predictions, then probability distributions are extremely valuable. They might allow you to predict when you’ll give birth, predict the distribution of heights in a given population, or guess when people will visit your website.
R
Rather than treating R as a programming language, we mostly employed RStudio (which essentially provides an interface to R) as a calculator. I don’t mean this as a criticism - we still got a lot out of the software. I think this was just a reflection of the fact that the course was about statistics and probability rather than about programming.
We used RStudio mainly for importing and describing data (via creating graphs, calculating standard deviation, etc.), calculating distributions, and doing regression analysis.
Lectures
Kit’s lectures were fine. He’s an engaging speaker, but there’s only so much you can do with a lecturn and PowerPoint.
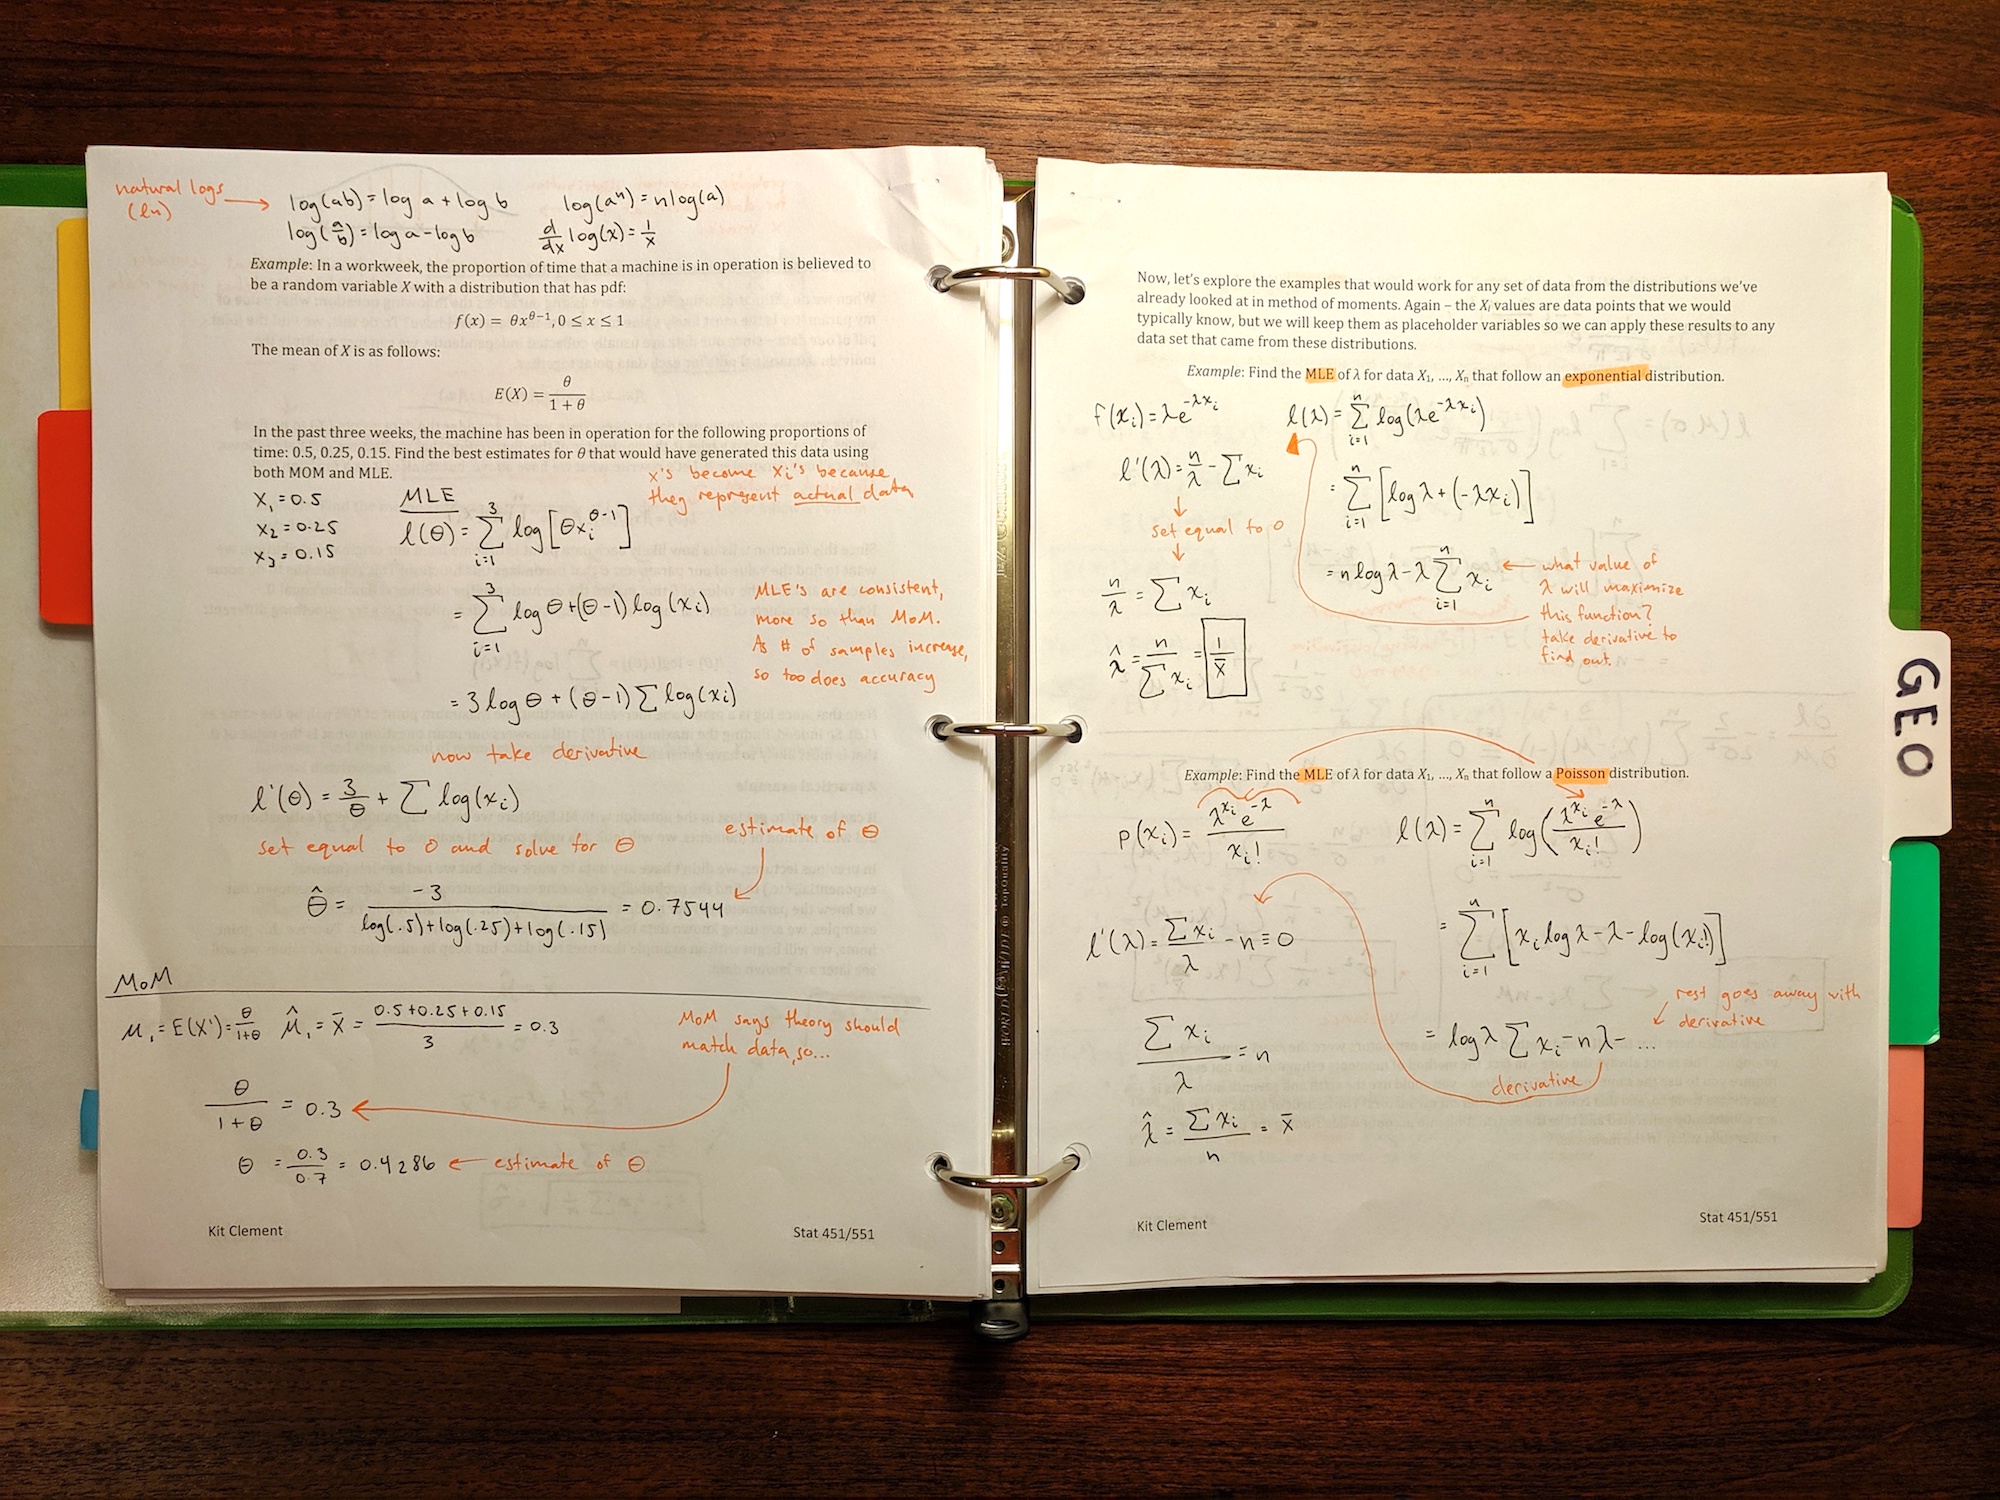 This course followed scaffolded notes like these. Most of the foundational information was filled out, and then we added in proofs, diagrams, and examples, following the direction of the instructor.
One thing I liked was that Kit provided scaffolded notes. He’d already filled out about half of the notes, and it was up to us to fill out the rest based on his lectures. I liked this because it gave me a chance to see how the lecture would progress and it helped me stay on track.
The only downside, as far as I could tell, is that scaffolded notes can make it easier to not engage with the material, since I was essentially just following what he was writing on the board without necessarily having to think critically.
Strategy
As in my other classes this term, I started out by making lots and lots of flashcards. Eventually I realized that we were allowed a cheat sheet on the midterm and final, which allowed me to put less emphasis on memorization. With that in mind, I began adding ideas to my cheat sheet instead of creating new flashcards for them.
I still practiced flashcards from time to time since it helped me recall and understand the material quickly. Capturing the entire class on a cheat sheet is worthless if you don’t understand what you’re capturing.
Assignments
In addition to the problem sets that we completed each week, we were given the option of completing a final regression assignment for extra credit. I chose to compare Portland’s population with the city’s air quality index (AQI). My analysis turned up a pretty weak relationship, but I did find, surprisingly, that Portland’s air quality has actually improved over the past 40 years, even as we’ve grown dramatically.
Exams
The midterm and final exam were given in a computer lab. We were given access to RStudio and whichever data sets we were being tested on. They were easy enough, though I still found a few questions that gave me trouble (I’m looking at you, joint probability distribution).
Onward
One of the main things I hope for my students is that they come away from the class more excited about the subject than they were when they started. That was my experience in this class. I’m looking forward to learning more about statistics and probability on my own and sharing it with my students.